Multiple Choice
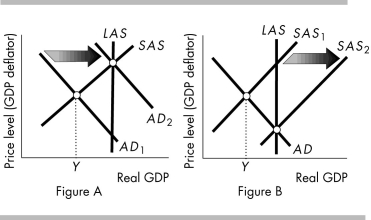
-Which aggregate supply-aggregate demand diagram above shows the effect on real GDP and the price level of monetary policy when it is used to fight a recession?
A) only Figure A
B) only Figure B
C) both Figure A and Figure B
D) neither Figure A nor Figure B
Correct Answer:

Verified
Correct Answer:
Verified
Related Questions
Q9: The key aim of monetary policy is
Q10: If the Federal Reserve decreases the Federal
Q11: Suppose the economy is in a recession
Q12: In 2012 the Fed announced that it
Q13: If the Fed is concerned about inflation,
Q15: If the Fed follows the Taylor rule
Q16: Which of the following is NOT a
Q17: To decrease inflation, the Federal Reserve would
Q18: The output gap is the<br>A) percentage deviation
Q19: In the short run, a cut in