Essay
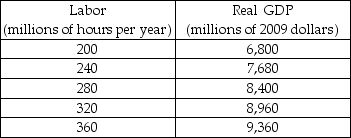
-The table above shows the aggregate production function in the economy of Prescottia. The people of Prescottia pay no taxes and are willing to work 248 million hours a year for a real wage rate of $8 an hour, and for each dollar increase in the real wage, they are willing to work 4 million additional hours per year.
a) Draw the economy's aggregate production function.
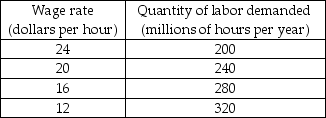 b) Prescottia's demand for labor schedule is in the table above. Draw Prescottia's demand for labor and supply of labor curves.
c) What are the economy's full-employment quantity of labor and real wage rate? What is the country's potential GDP?
d) Suppose that Prescottia's government introduces a 25 percent income tax. Using your graph, what happens to the demand for labor? What happens to the supply of labor? Explain.
e) After the tax is imposed, what happens to Prescottia's full-employment quantity of labor? What happens to Prescottia's potential GDP?
Correct Answer:

Verified
 a) See the figure above. b) See the fi...
View Answer
Unlock this answer now
Get Access to more Verified Answers free of charge
Correct Answer:
Verified
View Answer
Unlock this answer now
Get Access to more Verified Answers free of charge
Q189: A structural deficit occurs when the government
Q190: The tax rebates passed by Congress in
Q191: A government that currently has a budget
Q192: In 2007, Germany increased the value added
Q193: In 2007, France's government had revenue of
Q195: If tax receipts exactly equaled government outlays
Q196: An increase in the government _ reduces
Q197: <img src="https://d2lvgg3v3hfg70.cloudfront.net/TB8586/.jpg" alt=" -What is the
Q198: "More than 9,000 laid-off Nevada workers will
Q199: In response to the economic crisis in