Multiple Choice
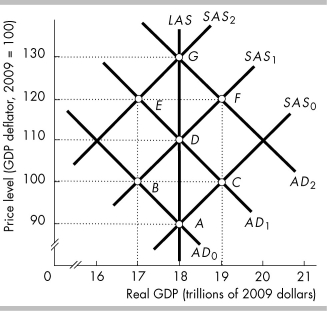
-In the above figure, which path represents a demand-pull inflation?
A) point A to C to D to F to G
B) point A to B to D to E to G
C) point A to C to D to E to G
D) point A to B to D to F to G
Correct Answer:

Verified
Correct Answer:
Verified
Related Questions
Q17: If the Fed responds to repeated decreases
Q18: The Cleveland Federal Reserve Bank estimates the
Q19: By itself, a fall in the price
Q20: According to the real business cycle theory,
Q21: An increase in the expected inflation rate
Q23: A rise in the price level because
Q24: An increase in the expected inflation rate
Q25: What is the impulse in the real
Q26: Stagflation is the combination of a _
Q27: What factors can start a cost-push inflation?