Multiple Choice
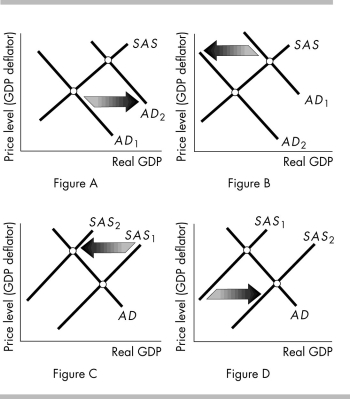
-In the above, which figure shows the start of a cost-push inflation?
A) Figure A
B) Figure B
C) Figure C
D) Figure D
Correct Answer:

Verified
Correct Answer:
Verified
Q1: The new classical cycle theory predicts that
Q2: The factor leading to business cycles in
Q4: An economy is in long-run equilibrium and
Q5: For a persistent cost-push inflation to occur,
Q6: <img src="https://d2lvgg3v3hfg70.cloudfront.net/TB8586/.jpg" alt=" -In the above
Q7: A change in the natural unemployment rate<br>A)
Q8: <img src="https://d2lvgg3v3hfg70.cloudfront.net/TB8586/.jpg" alt=" -Which of the
Q9: <img src="https://d2lvgg3v3hfg70.cloudfront.net/TB8586/.jpg" alt=" -In the above
Q10: If oil prices increase, then in the
Q11: <img src="https://d2lvgg3v3hfg70.cloudfront.net/TB8586/.jpg" alt=" -In the above