Multiple Choice
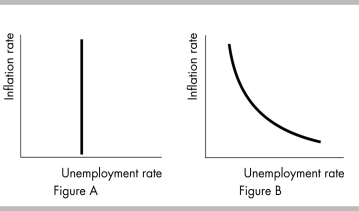
-Which of the diagrams in the above figure best illustrates a short-run Phillips curve?
A) Figure A
B) Figure B
C) both Figure A and Figure B
D) neither Figure A nor Figure B
Correct Answer:

Verified
Correct Answer:
Verified
Q249: The monetarist theory of the business cycle
Q250: Explain how the expected inflation rate affects
Q251: When there is a cost-push inflation<br>A) workers
Q252: Cost-push inflation starts with<br>A) an increase in
Q253: Which of the following leads to a
Q255: Describe how a demand-pull inflation can occur.
Q256: <img src="https://d2lvgg3v3hfg70.cloudfront.net/TB8586/.jpg" alt=" -In the above
Q257: Increases in government expenditure can create cost-push
Q258: <img src="https://d2lvgg3v3hfg70.cloudfront.net/TB8586/.jpg" alt=" -In the above
Q259: Which of the following describes the Keynesian