Multiple Choice
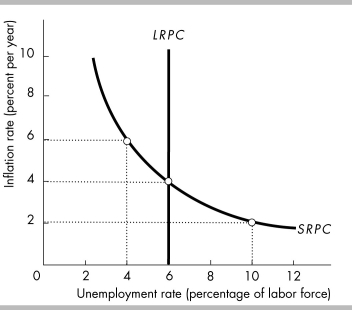
-The figure above shows an economy's Phillips curves. Currently, the inflation rate is 6 percent a year. The natural unemployment rate is ________ percent and the expected inflation rate is ________ percent a year.
A) 6; 6
B) 6; 10
C) 4; 6
D) 6; 4
Correct Answer:

Verified
Correct Answer:
Verified
Q386: Which theory assumes that business cycles occur
Q387: Demand-pull inflation can start when<br>A) the money
Q388: A Phillips curve shows the relationship between
Q389: In the short run, if there is
Q390: A story from www.ft.com (1/31/2005) describing Ireland's
Q392: The Cleveland Federal Reserve Bank's estimate of
Q393: Compare and contrast the Keynesian and Monetarist
Q394: <img src="https://d2lvgg3v3hfg70.cloudfront.net/TB8586/.jpg" alt=" -In the above
Q395: Increases in the quantity of money can
Q396: A criticism of the real business cycle