Multiple Choice
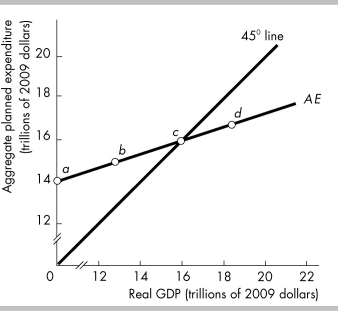
-The equilibrium in the above figure is shown at point
A) a.
B) b.
C) c.
D) d.
Correct Answer:

Verified
Correct Answer:
Verified
Related Questions
Q329: "When the price level increases, aggregate planned
Q330: <img src="https://d2lvgg3v3hfg70.cloudfront.net/TB8586/.jpg" alt=" -Based upon the
Q331: In general, the flatter the aggregate expenditure
Q332: If investment increases by $150 and, in
Q333: A fall in the price level shifts
Q335: Between 2012 and 2013 real GDP increased
Q336: Autonomous consumption is equal to<br>A) saving when
Q337: Real GDP equals $20 billion and aggregate
Q338: <img src="https://d2lvgg3v3hfg70.cloudfront.net/TB8586/.jpg" alt=" -Suppose the price
Q339: If the multiplier is 3.33 and there