Essay
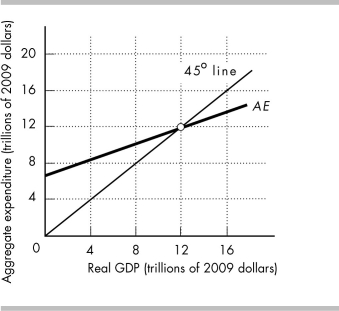
-The above figure shows the AE curve and 45° line for an economy.
a) If real GDP equals $8 trillion, how do firms' inventories compare to their planned inventories?
b) If real GDP equals $16 trillion, how do firms' inventories compare to their planned inventories?
c) What is the equilibrium level of expenditure? Why is this amount the equilibrium?
Correct Answer:

Verified
a) If real GDP equals $8 trillion, aggre...View Answer
Unlock this answer now
Get Access to more Verified Answers free of charge
Correct Answer:
Verified
View Answer
Unlock this answer now
Get Access to more Verified Answers free of charge
Q274: As real disposable income increases, consumption expenditure
Q275: If the MPC increases from 0.75 to
Q276: In a simple economy in which prices
Q277: When autonomous expenditure changes, the horizontal distance
Q278: What is the difference between movements along
Q280: The MPC and MPS sum to<br>A) 1.<br>B)
Q281: In the short run, the multiplier typically
Q282: <img src="https://d2lvgg3v3hfg70.cloudfront.net/TB8586/.jpg" alt=" -In the above
Q283: Imports and income taxes make the multiplier
Q284: <img src="https://d2lvgg3v3hfg70.cloudfront.net/TB8586/.jpg" alt=" -In the figure