Multiple Choice
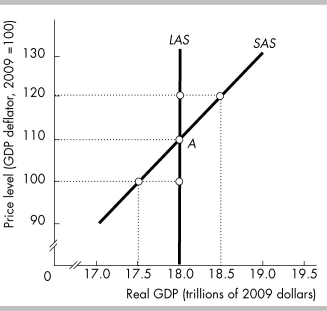
-In the figure above, potential GDP equals
A) $17.5 trillion.
B) $18.0 trillion.
C) $18.5 trillion.
D) None of the above answers is correct.
Correct Answer:

Verified
Correct Answer:
Verified
Related Questions
Q125: If taxes are increased, the AD curve<br>A)
Q126: If the economy is at long run
Q127: In the macroeconomic long run<br>A) real GDP
Q128: Which of the following events will increase
Q129: If there is an increase in technology,
Q131: If real GDP is less than potential
Q132: <img src="https://d2lvgg3v3hfg70.cloudfront.net/TB8586/.jpg" alt=" -In the above
Q133: What two variables are determined in an
Q134: The long-run aggregate supply curve is vertical
Q135: The economy is in its short run