Multiple Choice
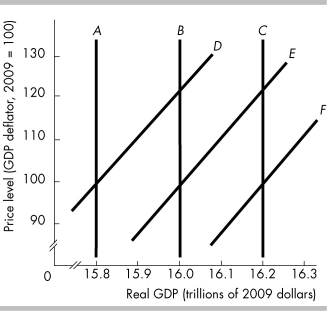
-In the above figure, B is the current long-run aggregate supply curve and E is the current short-run aggregate supply curve. If there is an increase in the full-employment quantity of labor, then the long-run aggregate supply curve and the short-run aggregate supply curve
A) remain B and E.
B) shift to A and D, respectively.
C) shift to C and F, respectively.
D) remain at B and shift at F, respectively.
Correct Answer:

Verified
Correct Answer:
Verified
Q56: <img src="https://d2lvgg3v3hfg70.cloudfront.net/TB8586/.jpg" alt=" -An inflationary gap
Q57: Business cycles are the result of<br>A) regular
Q58: Moving upward along the short-run aggregate supply
Q59: <img src="https://d2lvgg3v3hfg70.cloudfront.net/TB8586/.jpg" alt=" -The curve labeled
Q60: The aggregate demand curve shows that, if
Q62: <img src="https://d2lvgg3v3hfg70.cloudfront.net/TB8586/.jpg" alt=" -The reason that
Q63: <img src="https://d2lvgg3v3hfg70.cloudfront.net/TB8586/.jpg" alt=" -In the above
Q64: The quantity of real GDP demanded equals
Q65: In the short-run, real GDP can be
Q66: Substitution effects help explain the slope of