Multiple Choice
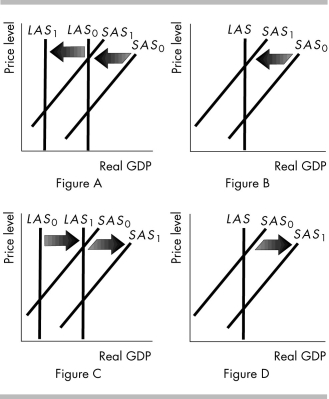
-In the above figure, which point corresponds to an increase in technology?
A) Figure A
B) Figure B
C) Figure C
D) Figure D
Correct Answer:

Verified
Correct Answer:
Verified
Related Questions
Q5: In a change to immigration policy during
Q6: If the economy is in long run
Q7: Which of the following is TRUE about
Q8: The U.S. aggregate demand curve shifts leftward
Q9: In a short-run macroeconomic equilibrium, real GDP
Q11: In the first half of 2008, food
Q12: One reason that the aggregate demand curve
Q13: The short-run aggregate supply curve shifts because
Q14: Compare the policy prescriptions of Keynesian, Classical,
Q15: <img src="https://d2lvgg3v3hfg70.cloudfront.net/TB8586/.jpg" alt=" -In the above