Multiple Choice
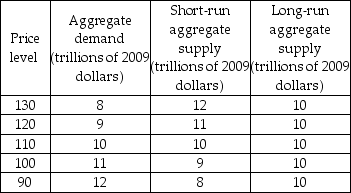
-The data in the above table indicate that when the price level is 120
A) firms have unexpectedly low inventories, so prices will rise.
B) inventories are at levels planned by firms.
C) firms will plan to increase the level of output.
D) firms have unexpectedly high inventories, so prices fall.
Correct Answer:

Verified
Correct Answer:
Verified
Q97: <img src="https://d2lvgg3v3hfg70.cloudfront.net/TB8586/.jpg" alt=" -In the above
Q98: Which of the following helps determine the
Q99: <img src="https://d2lvgg3v3hfg70.cloudfront.net/TB8586/.jpg" alt=" -In the above
Q100: We distinguish between the long-run aggregate supply
Q101: <img src="https://d2lvgg3v3hfg70.cloudfront.net/TB8586/.jpg" alt=" -In the above
Q103: <img src="https://d2lvgg3v3hfg70.cloudfront.net/TB8586/.jpg" alt=" -In the above
Q104: The long-run aggregate supply curve is<br>A) horizontal
Q105: What are the components of fiscal policy?
Q106: <img src="https://d2lvgg3v3hfg70.cloudfront.net/TB8586/.jpg" alt=" -The data in
Q107: <img src="https://d2lvgg3v3hfg70.cloudfront.net/TB8586/.jpg" alt=" -In the above