Multiple Choice
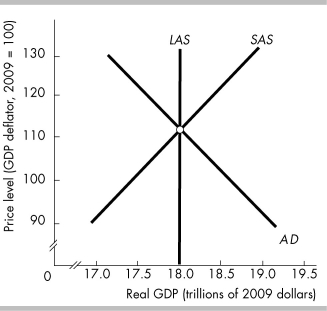
-The above figure depicts an economy with a short-run equilibrium
A) at full employment.
B) below full employment.
C) at higher than full employment.
D) at zero unemployment.
Correct Answer:

Verified
Correct Answer:
Verified
Q283: If you have $1,000 in wealth and
Q284: According to www.oecd.org, the United States spends
Q285: Technological progress will<br>A) shift the LAS curve
Q286: <img src="https://d2lvgg3v3hfg70.cloudfront.net/TB8586/.jpg" alt=" -In the above
Q287: The long-run aggregate supply curve is _
Q289: The supply of real GDP is a
Q290: <img src="https://d2lvgg3v3hfg70.cloudfront.net/TB8586/.jpg" alt=" -In the above
Q291: One reason that the aggregate demand curve
Q292: When the quantity of capital increases, then
Q293: The positive relationship between short-run aggregate supply