Multiple Choice
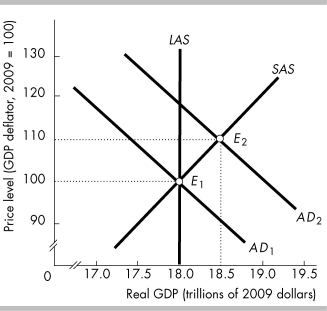
-In the above figure, the inflationary gap when AD2 is the aggregate demand curve equals
A) the difference between 110 and 100.
B) the difference between $18.5 trillion and $18.0 trillion.
C) LAS minus SAS at a price level of 100.
D) AD1.
Correct Answer:

Verified
Correct Answer:
Verified
Q148: In the aggregate demand-aggregate supply framework, how
Q149: <img src="https://d2lvgg3v3hfg70.cloudfront.net/TB8586/.jpg" alt=" -The data in
Q150: The land of Mordor increases its capital
Q151: The aggregate demand curve shows the _
Q152: Which of the following can be said
Q154: <img src="https://d2lvgg3v3hfg70.cloudfront.net/TB8586/.jpg" alt=" -Based on the
Q155: <img src="https://d2lvgg3v3hfg70.cloudfront.net/TB8586/.jpg" alt=" -The table above
Q156: According to the intertemporal substitution effect, a
Q157: In long-run macroeconomic equilibrium, the<br>A) real wage
Q158: A decrease in government expenditure shifts the