Multiple Choice
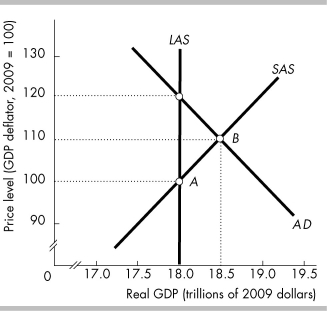
-In the above figure, suppose the economy had been at point A and now is at B. What could have led to the movement to B?
A) a tax increase
B) an increase in government expenditures on goods and services
C) Winter storms caused factories in the north to be shut down for several weeks.
D) an increase in the money wage rates
Correct Answer:

Verified
Correct Answer:
Verified
Q252: The short-run aggregate supply curve<br>A) shows what
Q253: All of the following shift the short-run
Q254: The quantity of real GDP supplied depends
Q255: An increase in the quantity of capital
Q256: Which of the following would NOT shift
Q258: Inflation occurs over time as a result
Q259: The short-run aggregate supply curve is upward
Q260: When talking about aggregate supply, it is
Q261: How do changes in the money wage
Q262: <img src="https://d2lvgg3v3hfg70.cloudfront.net/TB8586/.jpg" alt=" -In the above