menu-iconExamlexExamLexServices

Discover

Ask a Question
  1. All Topics
  2. Topic
    Business
  3. Study Set
    Economics-Macroeconomics
  4. Exam
    Exam 10: Aggregate Supply and Aggregate Demand
  5. Question
    -In the Above Figure, the Aggregate Demand Curve Is AD<sub>2</sub>
Solved

-In the Above Figure, the Aggregate Demand Curve Is AD2

Question 421

Question 421

Multiple Choice

  -In the above figure, the aggregate demand curve is AD<sub>2</sub>, so the short-run equilibrium level of real GDP is A)  $18 trillion. B)  $18.5 trillion. C)  more than $18 and less than $18.5 trillion. D)  None of the above answers is correct.
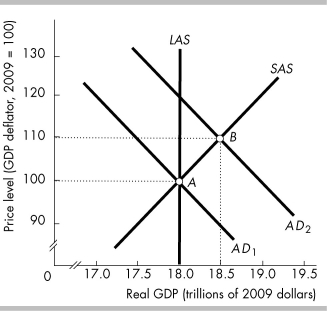
-In the above figure, the aggregate demand curve is AD2, so the short-run equilibrium level of real GDP is


A) $18 trillion.
B) $18.5 trillion.
C) more than $18 and less than $18.5 trillion.
D) None of the above answers is correct.

Correct Answer:

verifed

Verified

Unlock this answer now
Get Access to more Verified Answers free of charge

Related Questions

Q416: By using only the aggregate demand curve,

Q417: <img src="https://d2lvgg3v3hfg70.cloudfront.net/TB8586/.jpg" alt=" -In the above

Q418: Which of the following statements CORRECTLY describes

Q419: <img src="https://d2lvgg3v3hfg70.cloudfront.net/TB8586/.jpg" alt=" -The data in

Q420: If real GDP is less than potential

Q422: Suppose there is an increase in the

Q423: Over time in a growing economy, the

Q424: When the prices of U.S.-produced goods rise

Q425: One reason that the aggregate demand curve

Q426: The price level in India increases from

Examlex

ExamLex

About UsContact UsPerks CenterHomeschoolingTest Prep

Work With Us

Campus RepresentativeInfluencers

Links

FaqPricingChrome Extension

Download The App

Get App StoreGet Google Play

Policies

Privacy PolicyTerms of ServiceHonor CodeCommunity Guidelines

Scan To Download

qr-code

Copyright © (2025) ExamLex LLC.

Privacy PolicyTerms Of ServiceHonor CodeCommunity Guidelines