menu-iconExamlexExamLexServices

Discover

Ask a Question
  1. All Topics
  2. Topic
    Business
  3. Study Set
    Economics-Macroeconomics
  4. Exam
    Exam 10: Aggregate Supply and Aggregate Demand
  5. Question
    -In the Above Figure, the Aggregate Demand Curve Is AD<sub>2</sub>
Solved

-In the Above Figure, the Aggregate Demand Curve Is AD2

Question 223

Question 223

Multiple Choice

  -In the above figure, the aggregate demand curve is AD<sub>2</sub>, so the long-run equilibrium level of real GDP is A)  $18 trillion. B)  $18.5 trillion. C)  more than $18 and less than $18.5 trillion. D)  None of the above answers is correct.
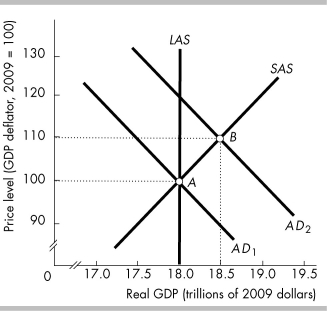
-In the above figure, the aggregate demand curve is AD2, so the long-run equilibrium level of real GDP is


A) $18 trillion.
B) $18.5 trillion.
C) more than $18 and less than $18.5 trillion.
D) None of the above answers is correct.

Correct Answer:

verifed

Verified

Unlock this answer now
Get Access to more Verified Answers free of charge

Related Questions

Q218: What could Keynes have meant by his

Q219: The SAS curve and the LAS curve<br>A)

Q220: <img src="https://d2lvgg3v3hfg70.cloudfront.net/TB8586/.jpg" alt=" -In the above

Q221: The business cycle occurs because aggregate demand

Q222: Which of the following occurs while moving

Q224: An economy is at full employment. Which

Q225: If the expected future inflation rate decreases,

Q226: <img src="https://d2lvgg3v3hfg70.cloudfront.net/TB8586/.jpg" alt=" -In the above

Q227: Assume that the economy is at a

Q228: A decrease in the money wage rate

Examlex

ExamLex

About UsContact UsPerks CenterHomeschoolingTest Prep

Work With Us

Campus RepresentativeInfluencers

Links

FaqPricingChrome Extension

Download The App

Get App StoreGet Google Play

Policies

Privacy PolicyTerms of ServiceHonor CodeCommunity Guidelines

Scan To Download

qr-code

Copyright © (2025) ExamLex LLC.

Privacy PolicyTerms Of ServiceHonor CodeCommunity Guidelines