Multiple Choice
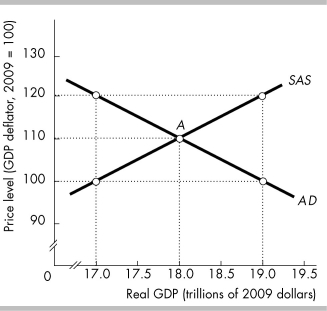
-In the above figure, the economy is at point A when changes occur. If the new equilibrium has a price level of 100 and real GDP of $19.0 trillion, then it must be the case that
A) aggregate demand has decreased.
B) aggregate supply has decreased.
C) aggregate demand has increased.
D) aggregate supply has increased.
Correct Answer:

Verified
Correct Answer:
Verified
Q373: The short-run aggregate supply curve<br>A) is vertical.<br>B)
Q374: In the long-run equilibrium, an increase in
Q375: In a short-run macroeconomic equilibrium, potential GDP
Q376: The aggregate demand curve<br>A) has a negative
Q377: <img src="https://d2lvgg3v3hfg70.cloudfront.net/TB8586/.jpg" alt=" -In the above
Q379: In Japan in 2010 the price level
Q380: The intertemporal substitution effect of the price
Q381: Suppose the price level rises and the
Q382: <img src="https://d2lvgg3v3hfg70.cloudfront.net/TB8586/.jpg" alt=" -In the above
Q383: According to the intertemporal substitution effect, when