Multiple Choice
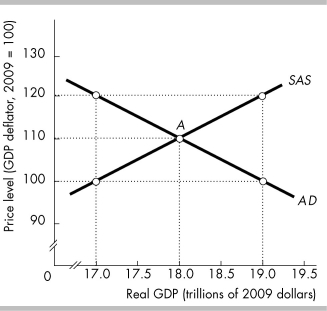
-In the above figure, the economy is at point A when changes occur. If the new equilibrium has a price level of 100 and real GDP of $17.0 trillion, then it must be the case that
A) aggregate demand has increased.
B) aggregate demand has decreased.
C) aggregate supply has decreased.
D) aggregate supply has increased.
Correct Answer:

Verified
Correct Answer:
Verified
Q161: The long-run aggregate supply curve is upward
Q313: <img src="https://d2lvgg3v3hfg70.cloudfront.net/TB8586/.jpg" alt=" -In the above
Q314: If aggregate demand grows only slightly faster
Q315: Which of the following does NOT shift
Q316: A technological advance _ the long-run aggregate
Q317: <img src="https://d2lvgg3v3hfg70.cloudfront.net/TB8586/.jpg" alt=" -The data in
Q319: What are the factors that can shift
Q320: The table below shows data for India's
Q321: How does the aggregate demand curve reflect
Q323: Long-run macroeconomic equilibrium is achieved when the