Multiple Choice
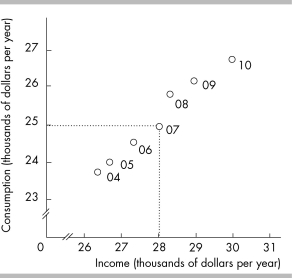
-The above figure plots income and consumption in a nation. In 2007
A) consumption was equal to $25,000 and income was equal to $28,000.
B) consumption was equal to $28,000 and income was equal to $25,000.
C) consumption was equal to $25,000 and income was equal to $25,000.
D) consumption was equal to $27,000 and income was equal to $31,000.
Correct Answer:

Verified
Correct Answer:
Verified
Q3: <img src="https://d2lvgg3v3hfg70.cloudfront.net/TB8586/.jpg" alt=" -What does the
Q305: In which of the following cases is
Q306: <img src="https://d2lvgg3v3hfg70.cloudfront.net/TB8586/.jpg" alt=" -In the figure
Q307: As a firm expands its output, cost
Q308: <img src="https://d2lvgg3v3hfg70.cloudfront.net/TB8586/.jpg" alt=" -The slope of
Q310: <img src="https://d2lvgg3v3hfg70.cloudfront.net/TB8586/.jpg" alt=" -In the above
Q311: <img src="https://d2lvgg3v3hfg70.cloudfront.net/TB8586/.jpg" alt=" -The slope of
Q312: The opportunity cost of something you decide
Q313: <img src="https://d2lvgg3v3hfg70.cloudfront.net/TB8586/.jpg" alt=" -In the figure
Q314: Macroeconomics is the study of aggregate variables