Multiple Choice
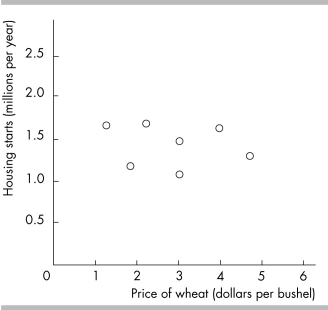
-The above figure graphs the price of a bushel of wheat and housing starts. The graph shows the variables are
A) strongly positively related.
B) strongly negatively related.
C) not related.
D) related via an indirect relationship.
Correct Answer:

Verified
Correct Answer:
Verified
Related Questions
Q344: <img src="https://d2lvgg3v3hfg70.cloudfront.net/TB8586/.jpg" alt=" -The above figure
Q345: Scarcity is a situation in which<br>A) some
Q346: Bill Bonecrusher graduates from college with a
Q347: A benefit from an increase in activity
Q348: The opportunity cost of attending college includes
Q350: What is opportunity cost?
Q351: Economics is best defined as the study
Q352: Explain why both rich and poor people
Q353: When I buy an $12.00 movie ticket
Q354: If you study 3 hours for an