Multiple Choice
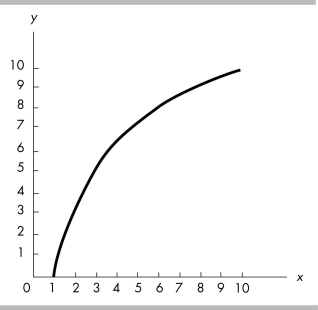
-The relationship depicted in the above figure is
A) a negative linear relationship.
B) a positive linear relationship.
C) a positive becoming less steep relationship.
D) a positive becoming steeper relationship.
Correct Answer:

Verified
Correct Answer:
Verified
Q77: <img src="https://d2lvgg3v3hfg70.cloudfront.net/TB8586/.jpg" alt=" -In the above
Q78: Dell Computers decides to produce PCs and
Q79: Jill, an economics student, has already spent
Q80: <img src="https://d2lvgg3v3hfg70.cloudfront.net/TB8586/.jpg" alt=" -The figure above
Q81: Suppose we are considering the relationship between
Q83: <img src="https://d2lvgg3v3hfg70.cloudfront.net/TB8586/.jpg" alt=" -In the above
Q84: <img src="https://d2lvgg3v3hfg70.cloudfront.net/TB8586/.jpg" alt=" -In the above
Q85: A positive relationship exists between two variables
Q86: A curve is plotted with y measured
Q87: Along a straight line, the value of