Multiple Choice
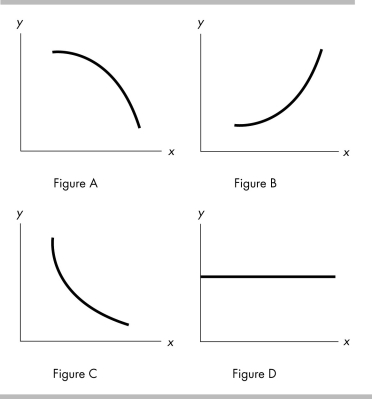
-In the above figure, if there is a negative relationship between the variables x and y, which of the graphs above can be used to indicate this?
A) Figure A
B) Figure B
C) Figure C
D) both Figure A and Figure C
Correct Answer:

Verified
Correct Answer:
Verified
Q208: <img src="https://d2lvgg3v3hfg70.cloudfront.net/TB8586/.jpg" alt=" -Using the data
Q209: <img src="https://d2lvgg3v3hfg70.cloudfront.net/TB8586/.jpg" alt=" -In the figure
Q210: Misty has the option of purchasing one
Q211: Which of the following is a macroeconomic
Q212: If a graph shows a negative relationship
Q214: A graph measures y on the vertical
Q215: In every economic system, choices must be
Q216: What is the difference between a positive
Q217: If an increase in x (the variable
Q218: Along a curved line, the slope at