Multiple Choice
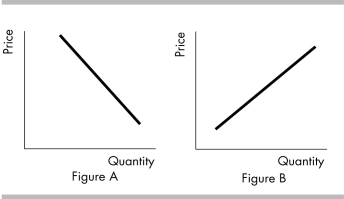
-In the above figure, a negative relationship between price and quantity is shown in
A) Figure A.
B) Figure B.
C) both Figure A and Figure B.
D) neither Figure A nor Figure B.
Correct Answer:

Verified
Correct Answer:
Verified
Related Questions
Q313: <img src="https://d2lvgg3v3hfg70.cloudfront.net/TB8586/.jpg" alt=" -In the figure
Q314: Macroeconomics is the study of aggregate variables
Q315: On a graph, an upward-sloping curve that
Q316: According to economists<br>A) market capitalism is the
Q317: What is the relationship between wants, factors
Q319: After you graduate, you have decided to
Q320: Differences in income are most directly related
Q321: The vertical axis in a graph<br>A) is
Q322: When a country decides to produce fewer
Q323: The vertical axis of a graph shows