Multiple Choice
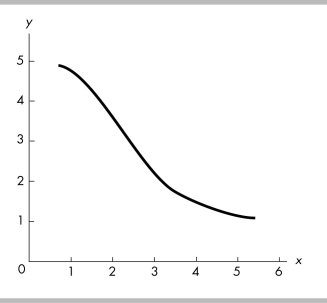
-The figure above shows
A) a positive relationship.
B) a direct relationship.
C) a negative relationship.
D) no relationship between the variables.
Correct Answer:

Verified
Correct Answer:
Verified
Related Questions
Q236: Suppose Company A's profits increase by $10
Q237: A graph of two variables is a
Q238: <img src="https://d2lvgg3v3hfg70.cloudfront.net/TB8586/.jpg" alt=" -In the above
Q239: As an economic concept, scarcity applies to<br>A)
Q240: The study of the choices made by
Q242: In economics, normative statements are about<br>A) the
Q243: <img src="https://d2lvgg3v3hfg70.cloudfront.net/TB8586/.jpg" alt=" -In the above
Q244: China's population is over 1.5 billion, while
Q245: The term "opportunity cost" points out that<br>A)
Q246: Your student association is looking for an