Multiple Choice
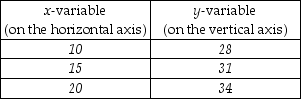
-The above table shows data on two variables. If these data were graphed, the slope of the line would be
A) 3/5.
B) 3.
C) 5/3.
D) impossible to determine from the information given.
Correct Answer:

Verified
Correct Answer:
Verified
Q285: Normative statements are statements about<br>A) prices.<br>B) quantities.<br>C)
Q286: The job that involves studying trends and
Q287: Laura is a manager for HP. When
Q288: <img src="https://d2lvgg3v3hfg70.cloudfront.net/TB8586/.jpg" alt=" -In the figure
Q289: <img src="https://d2lvgg3v3hfg70.cloudfront.net/TB8586/.jpg" alt=" -In the table
Q291: John has two hours of free time
Q292: An analyst on a local news channel
Q293: Jed had an exam score of 50
Q294: Suppose that you are spending two hours
Q295: <img src="https://d2lvgg3v3hfg70.cloudfront.net/TB8586/.jpg" alt=" -In the above