Multiple Choice
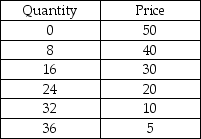
-If we use the numbers in the above table to draw a graph, with the price on the vertical axis and the quantity on the horizontal axis, the line relating price and quantity has a slope of
A) 0.8.
B) -8.0.
C) -1.25.
D) 8.0.
Correct Answer:

Verified
Correct Answer:
Verified
Q247: An example of a question that might
Q248: If the government raises the tax on
Q249: Joe likes to sleep late in the
Q250: <img src="https://d2lvgg3v3hfg70.cloudfront.net/TB8586/.jpg" alt=" -In the above
Q251: An economic system in which the government
Q253: Suppose that for the past two months,
Q254: Which of the following college majors experience
Q255: Suppose we are considering the relationship between
Q256: On the horizontal axis of a graph,
Q257: <img src="https://d2lvgg3v3hfg70.cloudfront.net/TB8586/.jpg" alt=" -The slope of