Multiple Choice
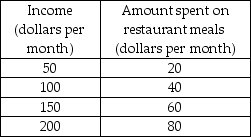
-Using the data in the above table, if income is on the x-axis and the amount spent on restaurant meals is on the y-axis, the slope of the straight line graph equals
A) 0.2.
B) 0.4.
C) 0.5.
D) 2.5.
Correct Answer:

Verified
Correct Answer:
Verified
Q95: The variable measured on the y-axis increases
Q96: Which of the following is a macroeconomic
Q97: Whenever one variable increases, another variable decreases.
Q98: When a California farmer decides to harvest
Q99: <img src="https://d2lvgg3v3hfg70.cloudfront.net/TB8586/.jpg" alt=" -What does the
Q101: Scarcity can be eliminated through<br>A) the use
Q102: When y changes, x stays the same.
Q103: Which of the following is NOT a
Q104: <img src="https://d2lvgg3v3hfg70.cloudfront.net/TB8586/.jpg" alt=" -The slope of
Q105: The statement "An increase in the price