Multiple Choice
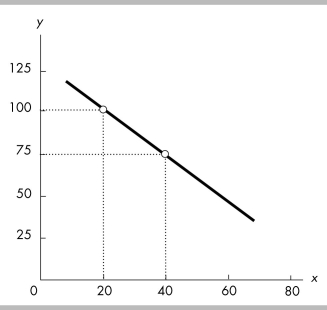
-The slope of the line shown in the above figure is
A) -1 1/3.
B) -1 2/3.
C) -1.25.
D) -0.80.
Correct Answer:

Verified
Correct Answer:
Verified
Related Questions
Q8: <img src="https://d2lvgg3v3hfg70.cloudfront.net/TB8586/.jpg" alt=" -Using the data
Q9: Janet Yellen, Chair of the Federal Reserve,
Q10: <img src="https://d2lvgg3v3hfg70.cloudfront.net/TB8586/.jpg" alt=" -In the above
Q11: Along a curve, when one variable increases,
Q12: Entrepreneurs do all of the following EXCEPT<br>A)
Q14: Suppose we are considering the relationship between
Q15: The loss of the highest-valued alternative defines
Q16: From 8 P.M. to 10 P.M., Susan
Q17: When graphed, variables that are unrelated are
Q18: What is the difference between microeconomics and