Multiple Choice
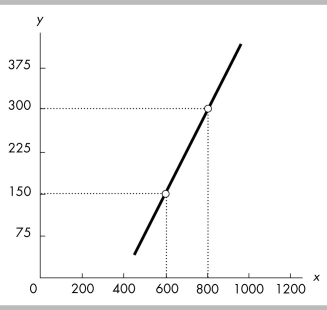
-The slope of the line shown in the above figure is
A) 2.
B) 0.75.
C) 0.25.
D) 1 1/3.
Correct Answer:

Verified
Correct Answer:
Verified
Related Questions
Q363: What is the difference between positive and
Q364: Copper falls into which factor of production
Q365: If there is an inverse relationship between
Q366: <img src="https://d2lvgg3v3hfg70.cloudfront.net/TB8586/.jpg" alt=" -In the above
Q367: The slope of a negative relationship is<br>A)
Q369: "As part of the financial crisis bailout
Q370: Which of the following is NOT a
Q371: The 2010 Patient Protection and Affordable Care
Q372: Economics can be defined as the social
Q373: Scarcity affects only those who are in