Multiple Choice
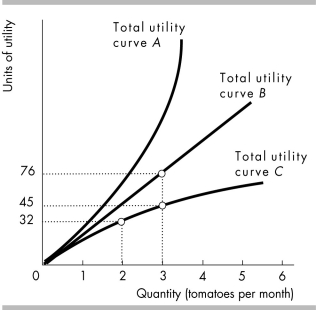
-In the figure above, the curve that shows the diminishing marginal utility is
A) total utility curve A because it gets steeper as consumption of tomatoes increases.
B) total utility curve A because it is higher than total utility curves B or C.
C) total utility curve C because it gets flatter as consumption of tomatoes increases.
D) total utility curve C because it is lower than total utility curves B and C.
Correct Answer:

Verified
Correct Answer:
Verified
Q319: To maximize her utility, Pat should spend
Q320: Jake has already bought his hockey gear
Q321: As you consume additional hamburgers, the relationship
Q322: Teddy buys only chocolate chip cookies and
Q323: Chips Sodas<br> <img src="https://d2lvgg3v3hfg70.cloudfront.net/TB8586/.jpg" alt="Chips Sodas
Q325: <img src="https://d2lvgg3v3hfg70.cloudfront.net/TB8586/.jpg" alt=" -The above table
Q326: At the utility maximizing equilibrium for two
Q327: According to a behavioral economist, people who
Q328: <img src="https://d2lvgg3v3hfg70.cloudfront.net/TB8586/.jpg" alt=" -The table above
Q329: Explain the paradox of value.