Multiple Choice
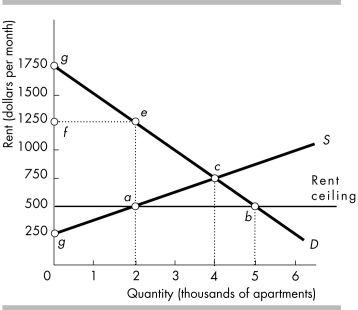
-The above figure shows the demand and supply curves for housing. What would be the effects of a rent ceiling equal to $500 per month?
A) a surplus equal to 3,000 apartments
B) a shortage equal to 3,000 apartments
C) a shortage equal to 250 apartments
D) nothing because the rent ceiling has no effect on the equilibrium price and quantity
Correct Answer:

Verified
Correct Answer:
Verified
Q284: Making the buying and selling of a
Q285: Which of the following leads to the
Q286: <img src="https://d2lvgg3v3hfg70.cloudfront.net/TB8586/.jpg" alt=" -In the above
Q287: <img src="https://d2lvgg3v3hfg70.cloudfront.net/TB8586/.jpg" alt=" -In the above
Q288: Why do rent ceilings lead to shortages
Q290: <img src="https://d2lvgg3v3hfg70.cloudfront.net/TB8586/.jpg" alt=" -In the above
Q291: <img src="https://d2lvgg3v3hfg70.cloudfront.net/TB8586/.jpg" alt=" -The above figure
Q292: In some recent past years, prices of
Q293: <img src="https://d2lvgg3v3hfg70.cloudfront.net/TB8586/.jpg" alt=" -Using the above
Q294: An upper limit to the quantity of