Multiple Choice
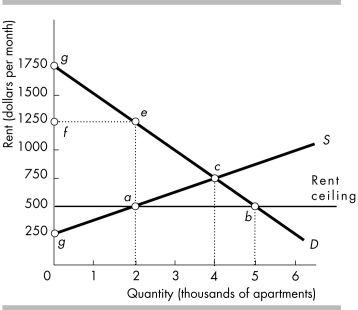
-The above figure shows the demand and supply curves for housing As a result of a rent ceiling at $500, the deadweight loss is represented by the area
A) rectangle feag.
B) triangle gfe.
C) triangle eca.
D) triangle acb.
Correct Answer:

Verified
Correct Answer:
Verified
Q128: <img src="https://d2lvgg3v3hfg70.cloudfront.net/TB8586/.jpg" alt=" -To help pay
Q129: <img src="https://d2lvgg3v3hfg70.cloudfront.net/TB8586/.jpg" alt=" -In the above
Q130: A student wrote: "A subsidy raises marginal
Q131: Consider the market for purple magic markers.
Q132: When a tax is imposed on a
Q134: When the government passes a law making
Q135: In a supply and demand diagram, illustrate
Q136: <img src="https://d2lvgg3v3hfg70.cloudfront.net/TB8586/.jpg" alt=" -In the above
Q137: <img src="https://d2lvgg3v3hfg70.cloudfront.net/TB8586/.jpg" alt=" -The above figure
Q138: <img src="https://d2lvgg3v3hfg70.cloudfront.net/TB8586/.jpg" alt=" -The above figure