Multiple Choice
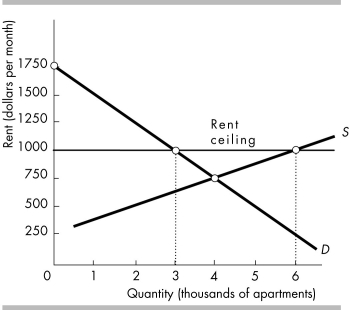
-The above figure shows the demand and supply curves for housing in City B. What would be the effects of a rent ceiling equal to $1000 per month?
A) a surplus equal to 3000 apartments
B) a surplus equal to 250 apartments
C) a shortage equal to 3000 apartments
D) nothing because the rent ceiling has no effect on the equilibrium price and quantity
Correct Answer:

Verified
Correct Answer:
Verified
Q150: <img src="https://d2lvgg3v3hfg70.cloudfront.net/TB8586/.jpg" alt=" -The above figure
Q151: In a supply and demand diagram, illustrate
Q152: <img src="https://d2lvgg3v3hfg70.cloudfront.net/TB8586/.jpg" alt=" -The figure above
Q153: One common effect of rent ceilings in
Q154: If the demand is perfectly elastic, buyers
Q156: Sherry wants to rent an apartment. Although
Q157: As long as the supply curve for
Q158: <img src="https://d2lvgg3v3hfg70.cloudfront.net/TB8586/.jpg" alt=" -The above figure
Q159: In 1920 a constitutional amendment was passed
Q160: <img src="https://d2lvgg3v3hfg70.cloudfront.net/TB8586/.jpg" alt=" -The figure above