Essay
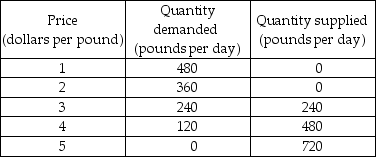
-The table above shows the demand and supply schedules for the market for coffee in Roastville. A tax on coffee of 75 cents per pound is proposed and the local government asks you to examine the effects of the tax.
a) Draw the demand and supply curves. If there is no tax on coffee, what is the price and how many pounds are sold?
b) With the tax, what is the price that consumers pay? What is the price that sellers receive? How many pounds of coffee are sold?
c) What is the government's total tax revenue? How much of the 75¢ per pound tax is paid by buyers? How much is paid by sellers?
d) If there are no external costs and benefits, what is the efficient level of coffee production?
e) If the tax is imposed, will the level of production be efficient? Why or why not?
Correct Answer:

Verified
 a) The figure is above. With no tax, th...
View Answer
Unlock this answer now
Get Access to more Verified Answers free of charge
Correct Answer:
Verified
View Answer
Unlock this answer now
Get Access to more Verified Answers free of charge
Q80: In some recent past years, prices of
Q81: <img src="https://d2lvgg3v3hfg70.cloudfront.net/TB8586/.jpg" alt=" -In the figure
Q82: A minimum wage is a government-imposed price
Q83: If salt has a _, then _
Q84: The Volumetric Ethanol Excise Tax Credit (VEETC)
Q86: <img src="https://d2lvgg3v3hfg70.cloudfront.net/TB8586/.jpg" alt=" -The figure above
Q87: The government wants to increase its tax
Q88: A sales tax is imposed on the
Q89: When a tax is imposed on sellers
Q90: <img src="https://d2lvgg3v3hfg70.cloudfront.net/TB8586/.jpg" alt=" -In the table