Essay
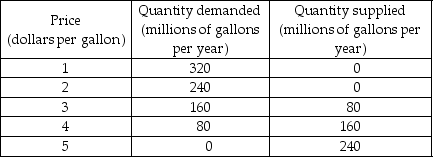
-The table above shows the demand and supply schedules for milk in Cowland. A subsidy on milk of $1 per gallon is proposed and the government asks you to examine the effects of the subsidy.
a) Draw the demand and supply curves. If there is no subsidy, what is the price of milk and how many gallons are sold?
b) With the subsidy, what is the price that consumers pay? What is the price that sellers receive? How many gallons of milk are sold?
c) Assuming no external costs and benefits, what is the efficient level of milk production? Explain.
d) With the subsidy, what is the marginal social benefit from milk? What is the marginal social cost of milk? If the subsidy is introduced, will the level of production be efficient? Why or why not?
Correct Answer:

Verified
 a) The figure above shows that with no ...
View Answer
Unlock this answer now
Get Access to more Verified Answers free of charge
Correct Answer:
Verified
View Answer
Unlock this answer now
Get Access to more Verified Answers free of charge
Q318: <img src="https://d2lvgg3v3hfg70.cloudfront.net/TB8586/.jpg" alt=" -In the above
Q319: If supply is perfectly elastic, a sales
Q320: <img src="https://d2lvgg3v3hfg70.cloudfront.net/TB8586/.jpg" alt=" -The figure above
Q321: The Volumetric Ethanol Excise Tax Credit (VEETC)
Q322: A good has a downward-sloping demand curve
Q324: The demand and the supply for a
Q325: The more _, the larger is the
Q326: How a sales tax is divided between
Q327: Compare and contrast a price ceiling and
Q328: <img src="https://d2lvgg3v3hfg70.cloudfront.net/TB8586/.jpg" alt=" -In the figure