Multiple Choice
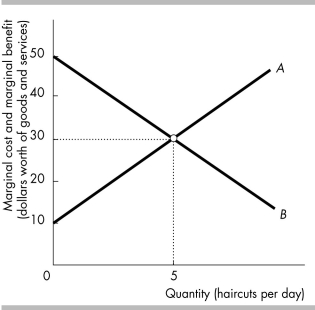
-The figure illustrates the market for haircuts. Curve A is the ________ curve, and curve B is the ________ curve.
A) marginal social cost; marginal social benefit
B) total social cost; total social benefit
C) opportunity cost; opportunity benefit
D) marginal social benefit; marginal social cost
Correct Answer:

Verified
Correct Answer:
Verified
Q397: The table below shows the supply schedules
Q398: Which of the following is TRUE?<br>A) When
Q399: <img src="https://d2lvgg3v3hfg70.cloudfront.net/TB8586/.jpg" alt=" -The figure above
Q400: <img src="https://d2lvgg3v3hfg70.cloudfront.net/TB8586/.jpg" alt=" -In the above
Q401: Which of the following conditions could lead
Q403: The producer surplus on a unit of
Q404: <img src="https://d2lvgg3v3hfg70.cloudfront.net/TB8586/.jpg" alt=" -The above figure
Q405: <img src="https://d2lvgg3v3hfg70.cloudfront.net/TB8586/.jpg" alt=" -The figure above
Q406: The table below shows the supply schedules
Q407: Which of these is NOT a potential