Multiple Choice
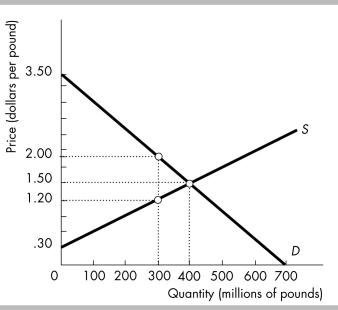
-The above figure shows the competitive market for turkey. The producer surplus for the 300 millionth pound of turkey is
A) $1.20 per pound.
B) $135 million.
C) $0.30 per pound.
D) $0.80 per pound.
Correct Answer:

Verified
Correct Answer:
Verified
Q109: The annual Great Sofa Round-up is a
Q110: <img src="https://d2lvgg3v3hfg70.cloudfront.net/TB8586/.jpg" alt=" -The above figure
Q111: The market demand curve<br>A) can also be
Q112: According to Utilitarian principles first discussed in
Q113: According to John Rawls, the fair distribution
Q115: <img src="https://d2lvgg3v3hfg70.cloudfront.net/TB8586/.jpg" alt=" -The figure above
Q116: If the marginal social cost of a
Q117: The market demand curve is constructed by
Q118: The market demand curve also is<br>A) a
Q119: <img src="https://d2lvgg3v3hfg70.cloudfront.net/TB8586/.jpg" alt=" -The figure above