Multiple Choice
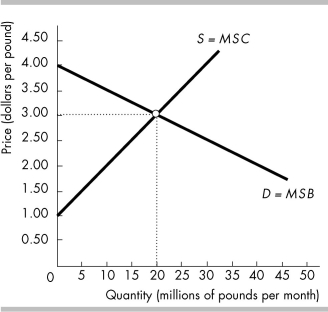
-The figure above shows the market for coffee. If the efficient quantity of coffee is produced, the producer surplus is
A) $10 million.
B) $20 million.
C) $60 million.
D) zero.
Correct Answer:

Verified
Correct Answer:
Verified
Q299: <img src="https://d2lvgg3v3hfg70.cloudfront.net/TB8586/.jpg" alt=" -In the above
Q300: <img src="https://d2lvgg3v3hfg70.cloudfront.net/TB8586/.jpg" alt=" -The above figure
Q301: Fitness is a magazine for women about
Q302: <img src="https://d2lvgg3v3hfg70.cloudfront.net/TB8586/.jpg" alt=" -The figure above
Q303: Consumers don't always have to pay the
Q305: <img src="https://d2lvgg3v3hfg70.cloudfront.net/TB8586/.jpg" alt=" -The figure illustrates
Q306: According to the "fair rules" view of
Q307: One problem with the utilitarian principle is
Q308: What is the significance of the concepts
Q309: Sam's demand curve for pizza<br>A) lies above