Multiple Choice
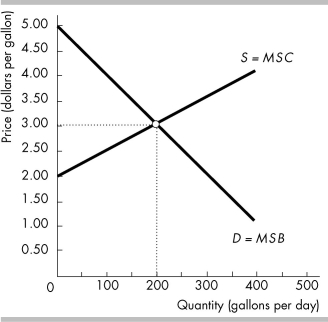
-The figure above shows the market for milk. When the efficient quantity of milk is produced, the marginal social benefit from the last gallon is
A) $2.00.
B) $2.50.
C) $3.00.
D) $3.50.
Correct Answer:

Verified
Correct Answer:
Verified
Q58: <img src="https://d2lvgg3v3hfg70.cloudfront.net/TB8586/.jpg" alt=" -The above table
Q59: A cost borne not by the producer
Q60: <img src="https://d2lvgg3v3hfg70.cloudfront.net/TB8586/.jpg" alt=" -The figure above
Q61: Why do societies face a tradeoff between
Q62: <img src="https://d2lvgg3v3hfg70.cloudfront.net/TB8586/.jpg" alt=" -In the above
Q64: What is the marginal cost of a
Q65: Deadweight loss can be the result of<br>A)
Q66: Alvin Roth of Harvard won the 2012
Q67: <img src="https://d2lvgg3v3hfg70.cloudfront.net/TB8586/.jpg" alt=" -The figure illustrates
Q68: Why does the problem of the big