Multiple Choice
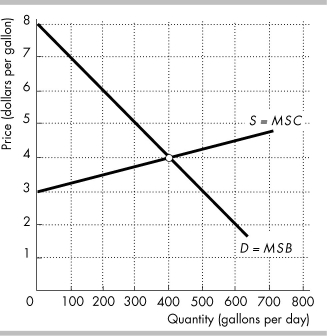 The figure shows the competitive market for milk.
-In the figure above, when the quantity of milk produced is 300 gallons per day, what is the deadweight loss?
A) $62.50
B) $125
C) $200
D) $937.50
Correct Answer:

Verified
Correct Answer:
Verified
Q289: <img src="https://d2lvgg3v3hfg70.cloudfront.net/TB8586/.jpg" alt=" -The figure above
Q290: Colorado State University allocates 10,000 tickets for
Q291: <img src="https://d2lvgg3v3hfg70.cloudfront.net/TB8586/.jpg" alt=" -The figure above
Q292: An external benefit is a benefit that<br>A)
Q293: Moving down along the market demand curve
Q295: <img src="https://d2lvgg3v3hfg70.cloudfront.net/TB8586/.jpg" alt=" -The above figure
Q296: Meat at the supermarket has contributed to
Q297: "If there is an inefficient level of
Q298: If the price of a pizza increases
Q299: <img src="https://d2lvgg3v3hfg70.cloudfront.net/TB8586/.jpg" alt=" -In the above