Essay
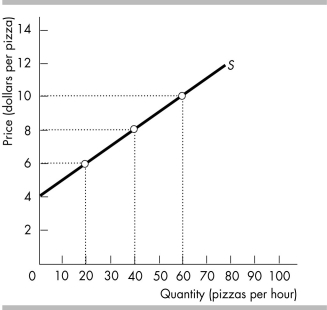
-The figure above shows the market supply curve for pizzas.
a) What is the marginal social cost of the 20th pizza?
b) What is the minimum supply price of the 20th pizza?
c) If the price is $6 per pizza, what is the producer surplus for the 20th pizza?
d) If the price is $6 per pizza, what is the total producer surplus?
e) If the price is $8 per pizza, what is the total producer surplus?
f) If the price is $10 per pizza, what is the total producer surplus?
Correct Answer:

Verified
a) The marginal cost of the 20th pizza i...View Answer
Unlock this answer now
Get Access to more Verified Answers free of charge
Correct Answer:
Verified
View Answer
Unlock this answer now
Get Access to more Verified Answers free of charge
Q306: According to the "fair rules" view of
Q307: One problem with the utilitarian principle is
Q308: What is the significance of the concepts
Q309: Sam's demand curve for pizza<br>A) lies above
Q310: <img src="https://d2lvgg3v3hfg70.cloudfront.net/TB8586/.jpg" alt=" -The figure above
Q312: When less than the efficient amount of
Q313: In a competitive equilibrium, the total consumer
Q314: A used car was recently priced at
Q315: <img src="https://d2lvgg3v3hfg70.cloudfront.net/TB8586/.jpg" alt=" -The table above
Q316: <img src="https://d2lvgg3v3hfg70.cloudfront.net/TB8586/.jpg" alt=" -The above figure