Essay
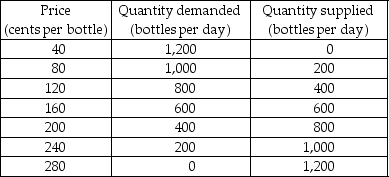
-The table above gives the demand and supply schedules for bottled spring water in Springsboro. Assume that the only people who benefit from spring water are the people who drink it and the only people who bear the cost of bottled spring water are the people who produce it.
a) Draw the market demand and market supply curves. What are the equilibrium price and equilibrium quantity of spring water? Is this equilibrium efficient? Explain.
b) What is the maximum price that consumers are willing to pay for the 400th bottle? What is the minimum price that producers are willing to accept for the 400th bottle? Explain.
c) Are 400 bottles a day less than or greater than the efficient quantity? Explain your answer.
d) If the market for spring water is efficient, what is the consumer surplus? Show it on your graph. What is the producer surplus? Show it on your graph.
e) If spring water bottlers produce 400 bottles a day, is there a deadweight loss? If yes, what is it? Explain your answer using your graph.
Correct Answer:

Verified
 a) The figure above shows the supply an...
View Answer
Unlock this answer now
Get Access to more Verified Answers free of charge
Correct Answer:
Verified
View Answer
Unlock this answer now
Get Access to more Verified Answers free of charge
Q41: The annual Great Sofa Round-up is a
Q42: <img src="https://d2lvgg3v3hfg70.cloudfront.net/TB8586/.jpg" alt=" -The figure above
Q43: The Wii is a wildly popular home
Q44: Marginal cost is the<br>A) extra benefit that
Q45: <img src="https://d2lvgg3v3hfg70.cloudfront.net/TB8586/.jpg" alt=" -The figure above
Q47: <img src="https://d2lvgg3v3hfg70.cloudfront.net/TB8586/.jpg" alt=" -The figure above
Q48: At the current level of output, the
Q49: Jason needs help getting ready for the
Q50: The night before enrollment was to open
Q51: <img src="https://d2lvgg3v3hfg70.cloudfront.net/TB8586/.jpg" alt=" -The figure above