Multiple Choice
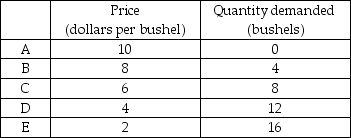
-The table above gives the demand schedule for peas. Between point A and point B, the price elasticity of demand equals
A) 0.11.
B) 0.50.
C) 0.22.
D) 9.09.
Correct Answer:

Verified
Correct Answer:
Verified
Related Questions
Q418: If the demand curve for oranges is
Q419: When the percentage change in quantity demanded
Q420: If the cross elasticity of demand between
Q421: Starting at the top of a straight-line
Q422: If the demand curve for tacos is
Q424: If the income elasticity of demand for
Q425: If the price of one good increases
Q426: Last year, after Shirley received a 14
Q427: Deb's income has just risen from $950
Q428: If the price elasticity of demand for