Multiple Choice
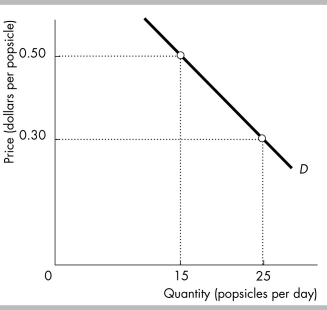
-The figure shows the demand curve for popsicles. The price elasticity of demand when the price of a popsicle increases from $0.30 to $0.50 is
A) 0.
B) 1.
C) 1/2.
D) 2.
Correct Answer:

Verified
Correct Answer:
Verified
Related Questions
Q78: Producers' total revenue will decrease if<br>A) income
Q79: A 10 percent decrease in the price
Q80: The elasticity of supply for paintings by
Q81: If the cross elasticity of demand between
Q82: How are the cross elasticity of demand
Q84: <img src="https://d2lvgg3v3hfg70.cloudfront.net/TB8586/.jpg" alt=" -The table above
Q85: The closer the substitutes for a good,
Q86: The demand for bus rides is a
Q87: The elasticity of supply does NOT depend
Q88: Apple, the consumer electronics giant, on Tuesday