Multiple Choice

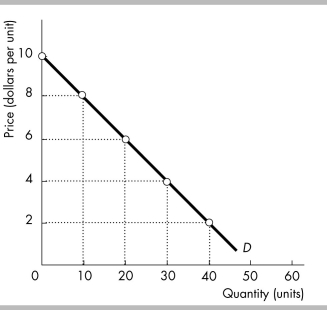
-The figure above illustrates a linear demand curve. If the price falls from $8 to $6
A) total revenue increases.
B) total revenue decreases.
C) total revenue remains unchanged.
D) the quantity demanded increases by less than 20 percent.
Correct Answer:

Verified
Correct Answer:
Verified
Related Questions
Q261: At the midpoint of a downward sloping
Q262: California is the sole producer of almonds
Q263: An inferior good is a good whose
Q264: The demand for a good is elastic
Q265: A supply curve that is horizontal reflects
Q267: <img src="https://d2lvgg3v3hfg70.cloudfront.net/TB8586/.jpg" alt=" -The figure above
Q268: The demand for computer chips is a
Q269: What are the three cases for the
Q270: If the quantity demanded changes by a
Q271: The price of a good rises by