Multiple Choice

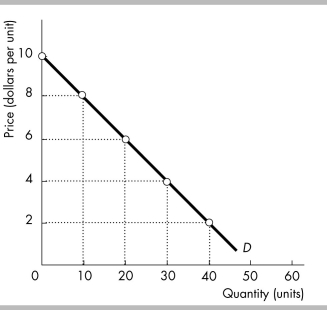
-The figure above illustrates a linear demand curve. In the price range from $8 to $6, demand is ________ and in the price range $4 to $2, demand is ________.
A) elastic; elastic
B) elastic; inelastic
C) inelastic; elastic
D) inelastic; inelastic
Correct Answer:

Verified
Correct Answer:
Verified
Related Questions
Q19: Business people often speak about price elasticity
Q20: To say that turnips are inferior goods
Q21: If demand is inelastic, an increase in
Q22: The price elasticity of demand equals the
Q23: The demand for _ is more elastic
Q25: The cost of basics like milk, bread,
Q26: What effect does a price increase have
Q27: Explain the total revenue test.
Q28: Dan sells newspapers. Dan says that a
Q29: Because Product X has a large positive