Multiple Choice
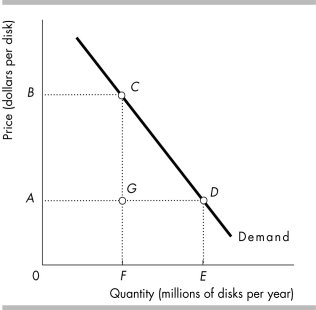
-In the figure above, when the price of a disk is $B, total revenue is shown in the graph by area
A) BCF0.
B) AGF0.
C) FCDE.
D) ADE0.
Correct Answer:

Verified
Correct Answer:
Verified
Related Questions
Q355: The more substitutes available for a product,
Q356: A rise in the price of cabbage
Q357: For inferior goods, the income elasticity of
Q358: If the long-run supply of rice is
Q359: <img src="https://d2lvgg3v3hfg70.cloudfront.net/TB8586/.jpg" alt=" -The demand curve
Q361: When Sam's annual income was only $15,000,
Q362: If cable TV subscriptions and movie rentals
Q363: If demand for Farmer John's maple syrup
Q364: If at a given moment, no matter
Q365: The greater the substitutability between Northwest timber