Multiple Choice
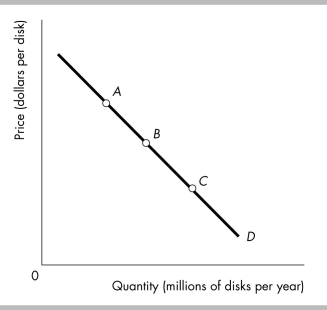
-The above figure shows a linear (straight-line) demand curve. Starting at point A and then moving to point B and then point C, the price elasticity of demand
A) increases.
B) decreases.
C) increases and then decreases.
D) decreases and then increases.
Correct Answer:

Verified
Correct Answer:
Verified
Q212: A 10 percent increase in income increases
Q213: Taco Bell's economists determine that the price
Q214: <img src="https://d2lvgg3v3hfg70.cloudfront.net/TB8586/.jpg" alt=" -The above table
Q215: Demand is price elastic if a<br>A) relatively
Q216: Specialty chocolate bars with a high cocoa
Q218: <img src="https://d2lvgg3v3hfg70.cloudfront.net/TB8586/.jpg" alt=" -The figure shows
Q219: Demand is inelastic if<br>A) a large change
Q220: Suppose that the cross elasticity of demand
Q221: If a 5 percent increase in price
Q222: If the quantity demanded of hamburgers increases