Essay
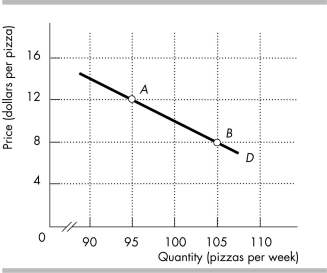
-The figure above shows the demand curve for pizza. Using the midpoint method and moving from point A to point B, calculate the
a) percentage change in price.
b) percentage change in quantity demanded.
c) price elasticity of demand.
Correct Answer:

Verified
a) Between points A and B, the...View Answer
Unlock this answer now
Get Access to more Verified Answers free of charge
Correct Answer:
Verified
View Answer
Unlock this answer now
Get Access to more Verified Answers free of charge
Q255: If the price elasticity of demand for
Q256: Based on the following pieces of information,
Q257: If the price of salt increases and
Q258: If students' expenditures on airline travel increase
Q259: <img src="https://d2lvgg3v3hfg70.cloudfront.net/TB8586/.jpg" alt=" -Suppose that business
Q261: At the midpoint of a downward sloping
Q262: California is the sole producer of almonds
Q263: An inferior good is a good whose
Q264: The demand for a good is elastic
Q265: A supply curve that is horizontal reflects